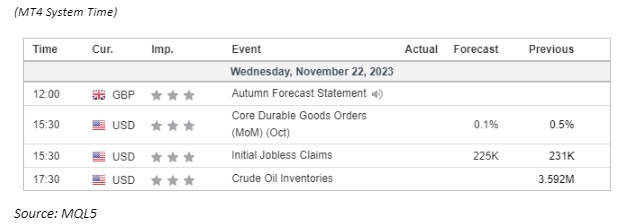
In a much-anticipated earnings release, Nvidia’s quarterly report beat expectations; however, the company’s share prices dropped about 2% after the closing bell. This unexpected downturn interrupted the recent winning streak in U.S. equity markets, dampening hopes for a tech-driven rally. Simultaneously, minutes from the Federal Reserve’s meeting revealed a unified and cautious approach to future rate hikes, signalling a dovish stance that could exert downward pressure on the strength of the dollar. Turning to the commodities market, oil prices stabilised ahead of the upcoming OPEC meeting, despite a significant U.S. stockpile buildup of over 9 million barrels. On the precious metals front, gold prices experienced a dip as Israel’s approval of a hostage deal and a temporary pause in the conflict with Hamas influenced market dynamics.
Current rate hike bets on 13rd December Fed interest rate decision:
Source: CME Fedwatch Tool
0 bps (95.0%) VS 25 bps (5%)


The US Dollar maintains its bearish stance as Federal Reserve minutes from the October 31st – November 1st meeting reveal a consensus among policymakers to keep interest rates unchanged until inflation demonstrates a clear downward trajectory. Investors interpret this as a potential signal that the Fed might halt its tightening monetary policy.
The Dollar Index is trading lower following the prior breakout below the previous support level. However, MACD has illustrated diminishing bearish momentum, while RSI is at 33, suggesting the index might enter oversold territory.
Resistance level: 104.15, 105.60
Support level: 103.05, 102.15
Gold prices continue their ascent, breaching the psychological barrier of $2000, propelled by the depreciation of the US Dollar. Concerns about cooling inflation and a sluggish labour market in the US contribute to speculation that the Fed may refrain from further rate increases, boosting the appeal of dollar-denominated gold.
Gold prices are trading higher while currently testing the resistance level. However, MACD has illustrated diminishing bullish momentum, while RSI is at 65, suggesting the commodity might enter overbought territory.
Resistance level: 2005.00, 2025.00
Support level: 1985.00, 1965.00
Despite a dollar rebound, the GBP/USD (Cable) stands firm due to hawkish remarks from Bank of England officials. BoE Governor Andrew Bailey downplayed recent data, emphasising persistent UK inflation, and committed to prolonged high interest rates. This contrasts with the Federal Open Market Committee’s dovish stance, revealed in meeting minutes, where U.S. central bank members collectively opted for caution in future rate hikes. The divergence in monetary policy outlooks shapes the dynamics influencing the GBP/USD pair.
The Cable is trading strongly with a higher price pattern, suggesting the bullish trend persists. The RSI hovers near the overbought zone while the MACD flows flat above the zero line, suggesting that the bullish momentum is still strong.
Resistance level: 1.2580, 1.2710
Support level: 1.2395, 1.2305
The EUR/USD pair underwent a technical retracement, remaining constrained below a significant resistance level at 1.0955. The dollar’s strength was sustained by the dovish tone emanating from the Federal Open Market Committee (FOMC) meeting minutes disclosed yesterday. The unanimity among board members in adopting a cautious stance towards future rate hikes hindered the dollar’s ability to rebound from its two-month low. This nuanced interplay of technical factors and central bank communications continues to shape the trajectory of the currency pair.
Despite a minor technical retracement, the EUR/USD pair is still trading in a bullish trend. The MACD is hovering flat above the zero line while the RSI has dropped out of the overbought zone, suggesting the bullish momentum has eased.
Resistance level:1.0955, 1.1041
Support level: 1.0866, 1.0770
US equities experienced a modest retreat, concluding a five-session winning streak, as a rebound in US Treasury yields following the FOMC meeting prompted some investors to reevaluate the possibility of the Federal Reserve maintaining restrictive rates in the longer term. Against the backdrop of the upcoming US holidays and a dearth of imminent catalysts for the equity market, several investors opted for profit-taking, contributing to the subdued market sentiment.
Nasdaq is trading higher following the prior breakout above the previous resistance level. However, MACD has illustrated diminishing bullish momentum, while RSI is at 72, suggesting the index might enter overbought territory.
Resistance level:16375.00, 17000.00
Support level: 15780.00, 15190.00
The USD/JPY pair persists in a bearish trend, with the Japanese Yen strengthening against the softened U.S. dollar. The Bank of Japan (BoJ) is reducing risk asset purchases, notably with zero acquisitions in real estate investment trusts this year, signalling robust growth in Japan. Market perception leans towards the BoJ nearing normalisation of its monetary policy, potentially ending its negative interest rate, further boosting the Japanese Yen’s strength. The dynamics suggest a continued trend of yen appreciation against the U.S. dollar.
The USD/JPY pair had a technical rebound lately but is firmly held below its strong resistance level at 148.40 level. The RSI has been hovering near the oversold zone while the MACD is on the brink of crossing below the zero line, suggesting the bearish momentum is easing slightly.
Resistance level: 149.30, 150.40
Support level: 147.48, 146.50
While oil prices remain relatively flat, a touch of bullish momentum emerges ahead of the weekend’s OPEC+ meeting. Investors anticipate potential measures to stabilise oil prices, especially after recent aggressive drops, leading to expectations of tightened oil supply.
Oil prices are trading higher following the prior breakout above the previous resistance level. However, MACD has illustrated diminishing bullish momentum, while RSI is at 57, suggesting the commodity might experience technical correction since the RSI retreated sharply from overbought territory.
Resistance level: 78.80, 80.75
Support level: 75.35, 72.60

Trade forex, indices, cryptocurrencies, and more at industry-low spreads and lightning-fast execution.

12 December 2023, 05:38 All Eyes On U.S. CPI Reading

11 December 2023, 05:23 Dollar Surges On Exceptional Jobs Data

8 December 2023, 05:50 Yen Rallies On BoJ Hawkish Comment

新註冊暫停
我們目前暫不接受新的註冊。
雖然目前無法接受新註冊,但現有用戶仍可照常進行挑戰和交易活動。