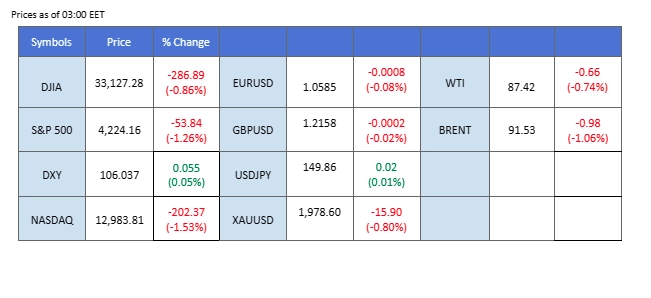
Amid diplomatic efforts to calm the Middle East conflict, Israel’s decision to halt its ground invasion on Gaza has momentarily eased tensions. Oil prices faced resistance at $90, leading to a decline since last Friday, while gold prices encountered selling pressure near the $2000 mark, prompting investors to book profits. The spotlight is on the U.S. long-term treasury yield, which has once again approached 5%. Market consensus suggests that a high treasury yield might prompt the Federal Reserve to consider concluding its monetary tightening campaign. Simultaneously, the Japanese Yen is on the verge of reaching the $150 threshold against the USD. Anticipation looms regarding a potential shift in the Bank of Japan’s monetary policy, driven by the country’s seemingly sustainable inflation rate. .
Current rate hike bets on 1st November Fed interest rate decision:
Source: CME Fedwatch Tool
0 bps (88.0%) VS 25 bps (12%)


The U.S. Dollar witnessed a decline as market participants await fresh insights into economic conditions. Investors are closely monitoring this week’s key economic data releases in the U.S., including third-quarter GDP growth and the Core PCE Price Index. These indicators are expected to shed light on the strength of the U.S. economy and influence market sentiment, given the Federal Reserve’s data-dependent approach to future monetary policy decisions.
The Dollar Index is trading lower following prior retracement from the resistance level. MACD has illustrated increasing bearish momentum, while RSI is at 44, suggesting the index might extend its losses since the RSI stays below the midline.
Resistance level: 106.60, 107.15
Support level: 105.65, 104.80
Gold prices saw a slight retracement as investors engaged in profit-taking after reaching a three-month high. In the long-term view, gold’s bullish bias persists, supported by a waning risk appetite in the global financial market. Market participants will closely watch developments in the U.S. economy and ongoing geopolitical risks for further trading cues.
Gold prices are trading lower following the prior retracement from the resistance level. MACD has illustrated increasing bearish momentum, while RSI is at 65, suggesting the commodity might enter overbought territory.
Resistance level: 1980.00, 2002.00
Support level: 1960.00, 1945.00
The Euro held steady as markets await the European Central Bank’s (ECB) meeting this Thursday, widely expected to maintain current interest rates after a series of recent hikes. Policymakers are pausing to evaluate the effects of monetary tightening. Worries loom over the Eurozone’s economic outlook, driven by subdued consumer spending amid high inflation and geopolitical uncertainties in the Middle East. The ECB’s decision remains in focus amid these economic intricacies.
EUR/USD is trading flat while currently near the resistance level. However, MACD has illustrated diminishing bullish momentum, while RSI is at 56, suggesting the pair might experience technical correction since the RSI retreated from its overbought territory.
Resistance level: 1.0630, 1.0795
Support level: 1.0450, 1.0325
With the U.S. long-term treasury yields inching closer to the 5% mark, the market sentiment is shifting towards the possibility that the Federal Reserve might have reached its peak interest rate. Meanwhile, alleviating tension in the Middle East contributed to a sideways movement in the dollar since last Friday. Consequently, the British Pound saw a modest technical rebound due to the softened dollar. Investors are closely monitoring key economic indicators from the UK, such as the unemployment rate and PMIs, as these data points are anticipated to influence the strength of the Sterling.
The Cable has eased from its bearish momentum and has found support at 1.2100 level. The RSI and the MACD have been moving flat and have given neutral signals for the Cable.
Resistance level: 1.2220, 1.2300
Support level: 1.2100, 1.2050
Risk appetite remains subdued in the global financial market, with the CBOE Volatility Index hitting its highest level in nearly seven months. Geopolitical tensions in the Middle East have contributed to the ongoing selloff in higher-risk equities, adding to the already cautious market sentiment. This week, investors eagerly anticipate earnings reports from major companies, including Microsoft, Alphabet (Google), Meta Platforms, and Amazon. Last Friday, the Dow Jones fell 1.60%, while the Nasdaq tumbled 3.2%, and the S&P 500 dropped 2.40%, highlighting significant market turbulence.
The Dow is trading lower following the prior breakout below the previous support level. MACD has illustrated increasing bearish momentum, while RSI is at 35, suggesting the index might extend its losses toward support level since the RSI stays below the midline.
Resistance level: 33370.00, 33895.00
Support level: 32840.00, 32015.00
Although the dollar’s strength has recently tempered, the USD/JPY pair remains elevated, nearing the crucial $150 threshold. There is widespread anticipation in the market regarding a potential shift in the Bank of Japan’s monetary policy, driven by the sustainable inflation in Japan. The upcoming policy meeting of the BoJ’s board next week is being closely observed, with investors eagerly seeking insights into the Japanese Central Bank’s future monetary strategies. Market dynamics surrounding this event are poised for significant developments.
The USD/JPY is currently traded in a narrow price consolidation range just below the $150 mark. The RSI and the MACD flow flat at a higher level, suggesting that the bullish momentum is still intact with the pair.
Resistance level: 150.00, 151.45
Support level: 148.42, 146.50
Oil markets experienced a downturn as tensions in the Middle East showed signs of easing. The release of two U.S. hostages by Hamas raised hopes of de-escalation in the Israeli-Palestinian crisis, albeit with lingering uncertainties. The situation underscores the region’s potential impact on global oil markets.
Oil prices are trading lower following the prior retracement from the resistance level. MACD has illustrated increasing bearish momentum, while RSI is at 47, suggesting the commodity might extend its losses in short-term since the RSI stays below the midline.
Resistance level: 89.35, 94.00
Support level: 86.40, 82.50

Trade forex, indices, cryptocurrencies, and more at industry-low spreads and lightning-fast execution.

12 December 2023, 05:38 All Eyes On U.S. CPI Reading

11 December 2023, 05:23 Dollar Surges On Exceptional Jobs Data

8 December 2023, 05:50 Yen Rallies On BoJ Hawkish Comment