2 June 2023,06:05
Daily Market Analysis

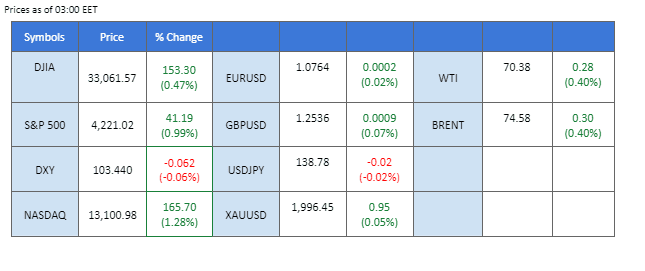
The focus of attention is currently directed towards the U.S. Senate, where the passage of the debt limit is being closely observed. Concurrently, senators are engaged in debates concerning 11 amendments to the bill. The value of the dollar has experienced a significant decline of over 0.6%, largely influenced by the expressed support from the President of the Philadelphia Federal Reserve to skip a rate hike in June. In New Zealand, the country’s import volume has reached its highest level in two years, intensifying the risks associated with a potential recession. Consequently, the New Zealand dollar may face downward pressure due to the pessimistic economic outlook. On the contrary, oil prices have seen a notable rebound of 3.8%, buoyed by positive sentiments surrounding the debt ceiling bill and aided by the dollar’s weakening.
Current rate hike bets on 14th June Fed interest rate decision:
Source: CME Fedwatch Tool
0 bps (74%) VS 25 bps (26%)

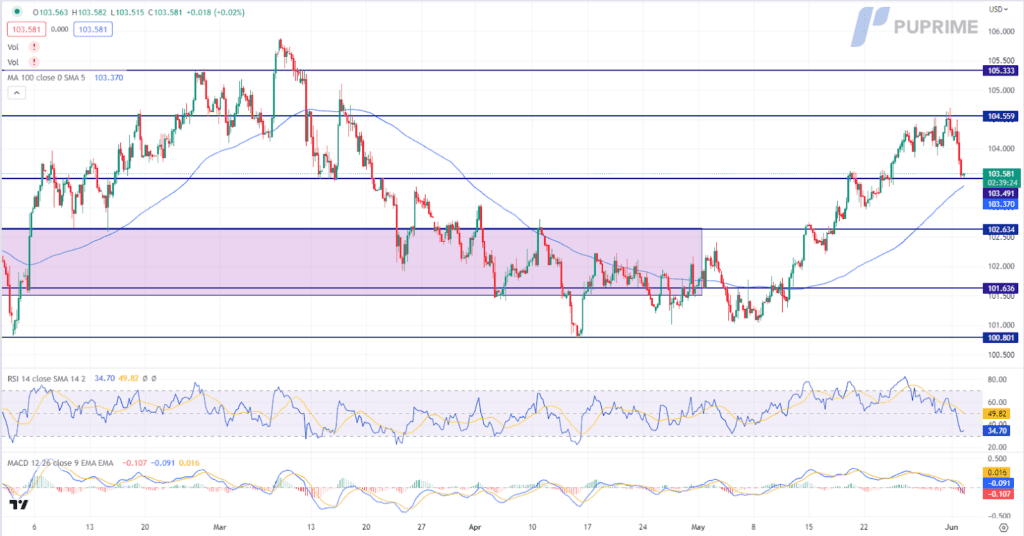
The Dollar Index faced its most substantial daily decline in nearly a month as the Federal Reserve’s stance on interest rate hikes came into focus. Comments from Federal Reserve officials echoed market expectations of a potential pause in the central bank’s tightening cycle during its upcoming meeting. This shift in sentiment has triggered a significant revision in market probabilities, with investors now perceiving a diminished likelihood of an interest rate hike in June, according to the CME FedWatch Tool. The CME FedWatch Tool revealed a stark shift in sentiment, with the likelihood of a 25 basis points rate hike during the June meeting dropping to approximately 32% from the prior day’s estimation of nearly 67%.
The Dollar Index is trading lower while currently testing the support level. MACD has illustrated increasing bearish momentum, while RSI is at 35, suggesting the index might extend its losses after breakout since the RSI stays below the midline.
Resistance level: 104.55, 105.35
Support level: 103.50, 102.65
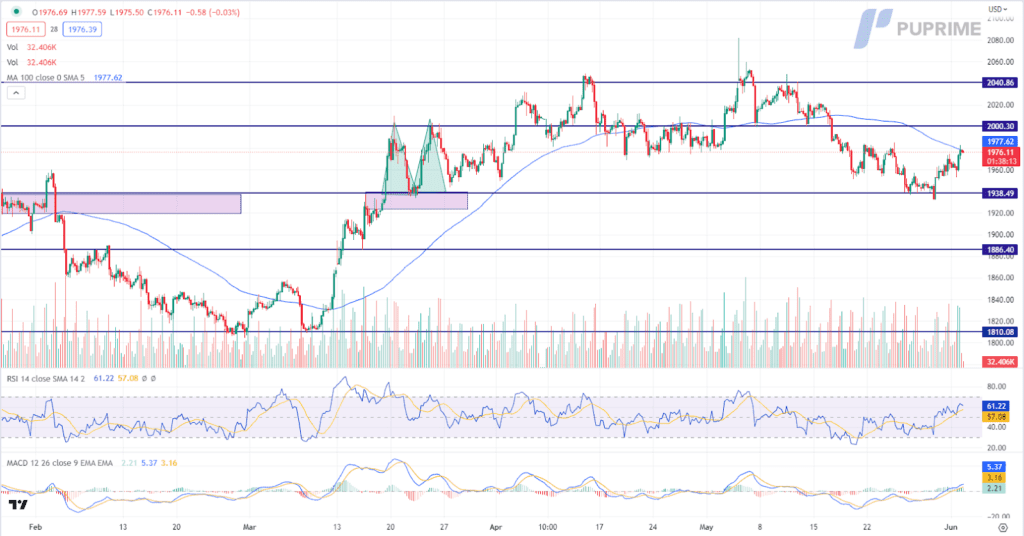
Gold prices experienced a substantial surge as the US Dollar depreciated, driven by the Federal Reserve’s dovish stance on interest rate hikes. The Dollar Index faced its largest daily decline in almost a month, reflecting the market’s increasing expectation of a pause in the central bank’s tightening cycle. Comments from Federal Reserve officials aligning with this sentiment led to a significant shift in market probabilities, with investors now perceiving a reduced likelihood of an interest rate hike in June. According to the CME FedWatch Tool, the probability of a 25 basis points rate hike during the upcoming meeting plummeted from around 67% to approximately 32%.
Gold prices are trading higher following the prior rebound from the support level. MACD has illustrated increasing bullish momentum, while RSI is at 61, suggesting the commodity might extend its gains toward resistance level since the RSI stays above the midline.
Resistance level: 2000.00, 2040.00
Support level: 1940.00, 1885.00
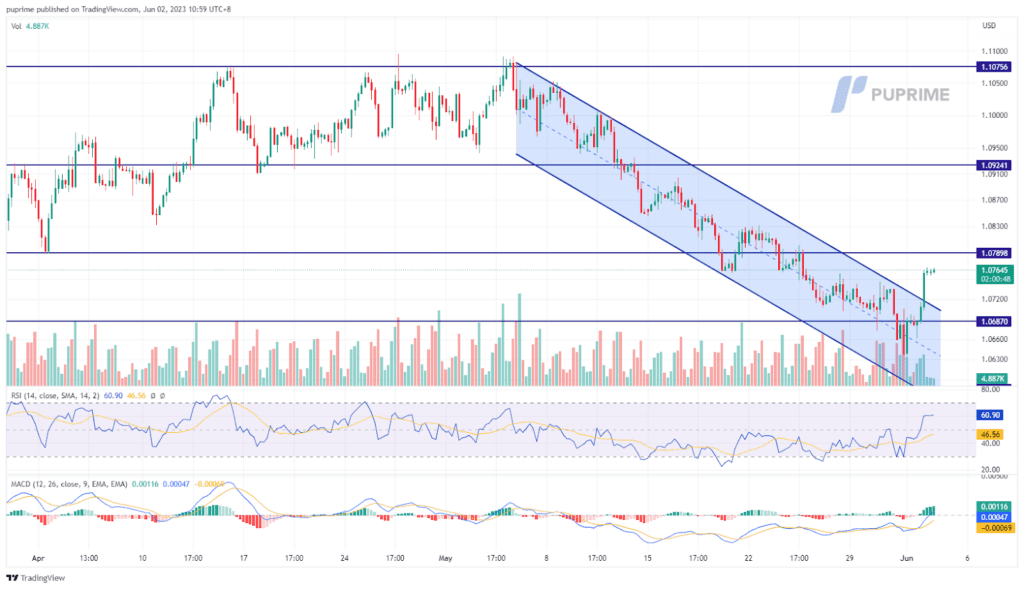
The euro has broken through its downtrend channel and rebounded by nearly 0.7%. After the Fed vice chair advocated skipping the June rate hike, the Fed’s Philadelphia president has supported the idea, which put downward pressure on the dollar. In contrast, the Europe CPI reading came lower than expected at 6.1%, down from the previous reading of 7%, this may lead to a more lenient monetary policy from the ECB despite the fact that it is almost certain that the ECB will increase the rate by 25 bps in June.
The euro has a sign of trend reversal as the pair has broken through the bearish channel. The RSI has rebounded to above 50-level, which indicates an increase in buying power, while the MACD is moving toward the zero line from below.
Resistance level: 1.0789, 1.0924
Support level: 1.0687, 1.0587
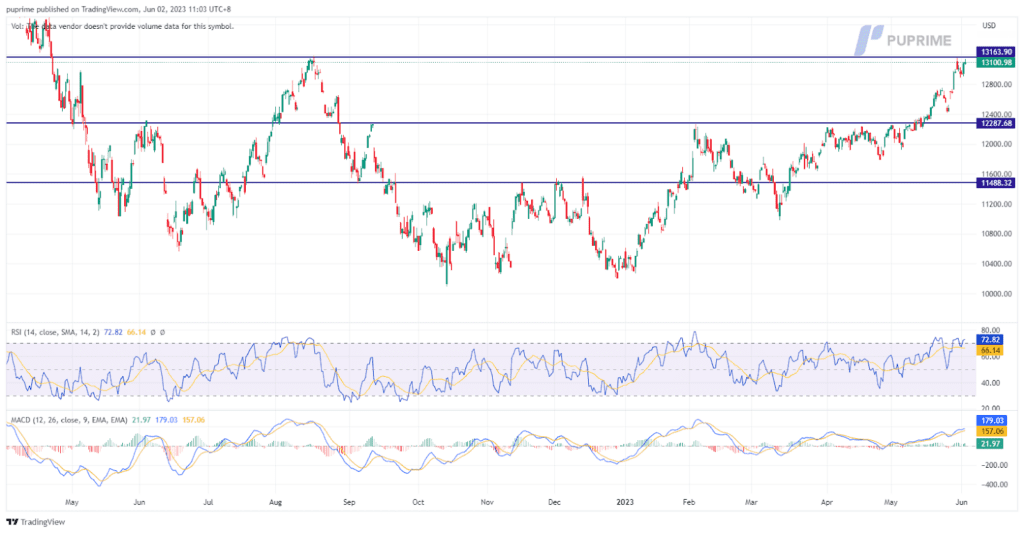
On Thursday, the Nasdaq experienced a notable surge of 1.28% to reach nine-month closing highs. This boost was attributed mainly to the impressive performance of Nvidia Corp (NVDA.O), which saw its stock rise by 5.1%. Although Nvidia fell short of entering the elite club of companies valued at $1 trillion or more, its contribution to the overall market sentiment was significant. Signs of slowing wage pressure further supported the positive market mood and hopes that the Federal Reserve would pause its interest rate hikes. These factors combined to create a favourable environment for the Nasdaq’s upward trajectory.
The MACD indicator indicates a bullish momentum ahead, suggesting potential upward movement in the market. However, it’s worth noting that the RSI (Relative Strength Index) is reaching the overbought zone, which could signal a potential technical retracement. Investors should be cautious and consider the possibility of a pullback or consolidation in the near term.
Resistance level: 13163, 14163
Support level: 12287, 11488
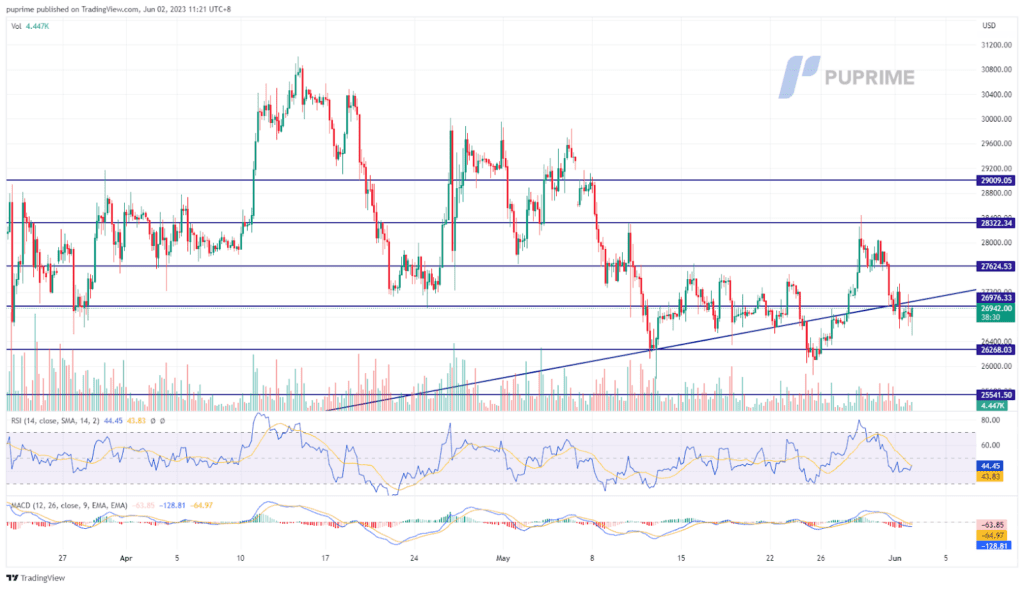
BTC was not stimulated by the optimistic news over the debt ceiling bill, passed at the House of Representatives and traded sideways. On top of that, a dovish stance from the Fed that signals for a skip in the June rate hike, which weakens the dollar, failed to support BTC to trade higher. However, industry participants see the rise of the BRC-20 token, a token built upon the Bitcoin ecosystem that may boost the demand for BTC.
The indicators suggest BTC still trades sluggishly. The RSI still hovers near the oversold region, while the MACD has just broken below the zero line suggesting a bearish signal.
Resistance level: 27624, 28320
Support level: 26268, 25541
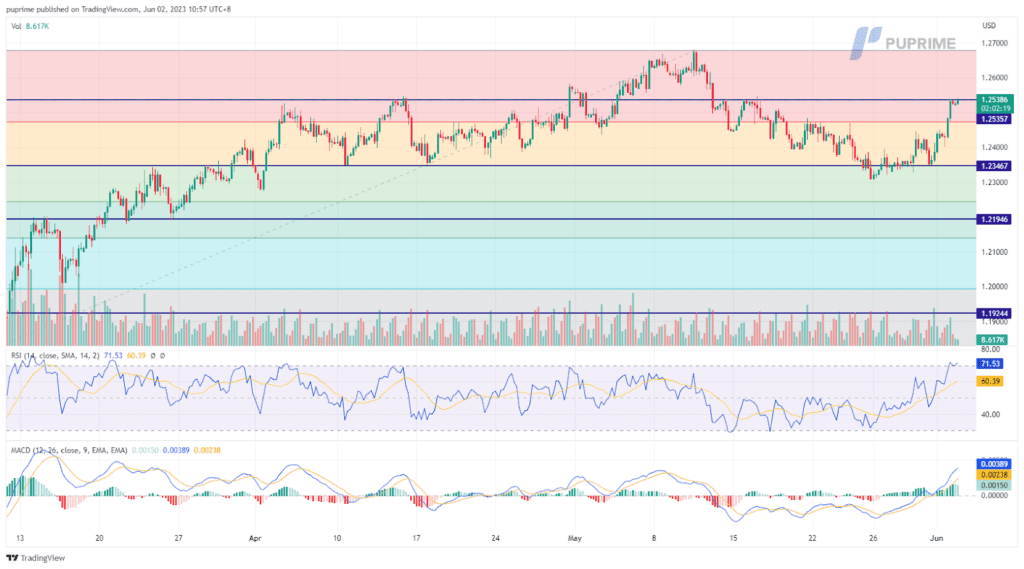
The British pound gained 1.08% to $1.2539 against the U.S. dollar on Thursday as the likelihood of the Federal Reserve skipping a rate hike increased. It resulted in a dip in the dollar’s value, allowing the pound to edge up. The U.K., however, faces challenges with slow economic growth and high inflation compared to other G7 economies. Therefore, the Bank of England is expected to raise interest rates this month, which could give the pound an advantage against the dollar.
Both the MACD and RSI indicate a bullish momentum ahead. These indicators suggest a favourable outlook for the asset, indicating the potential for further price appreciation and encouraging traders to consider bullish positions. However, it is important to consider other factors and conduct a thorough analysis before making any trading decisions.
Resistance level: 1.2679, 1.2800
Support level: 1.2346, 1.2194
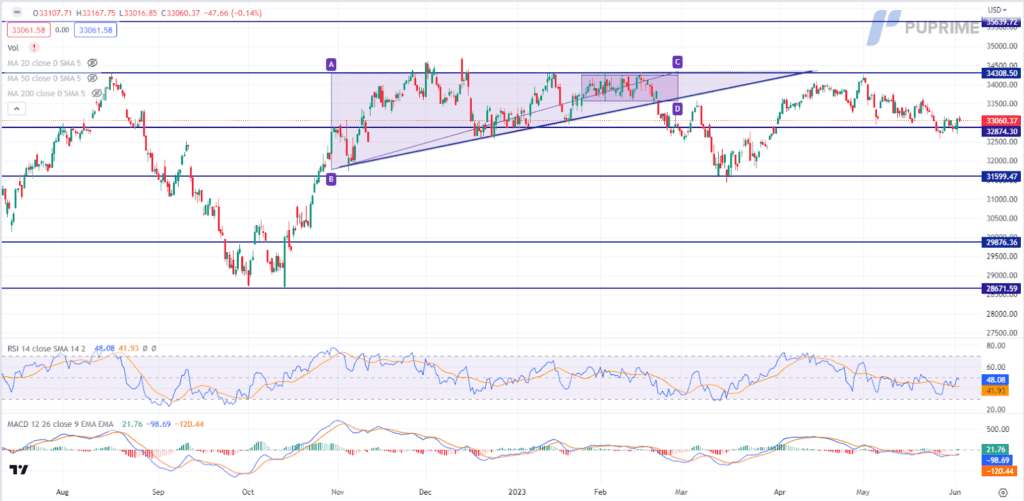
The Dow staged an impressive rebound as the Federal Reserve adopted a dovish stance and signaled its intention to pause interest rate hikes during the upcoming monetary policy meeting. The prospect of lower interest rates has ignited optimism among investors, particularly in the equity market, as it is widely believed that reduced borrowing costs stimulate economic growth and bolster corporate profitability. With the Federal Reserve’s commitment to maintaining a more neutral stance, supported by the remarks of Federal Reserve Bank of Philadelphia President Patrick Harker, market participants are growing increasingly confident that the central bank will prioritise containing inflation rather than tightening monetary policy.
The Dow is trading higher following prior rebounded from the support level. MACD has illustrated increasing bullish momentum, while RSI is at 48, suggesting the index might extend its gains toward resistance level since the RESI rebounded sharply from the support level.
Resistance level: 34310.00, 35640.00
Support level: 32875.00, 31600.00
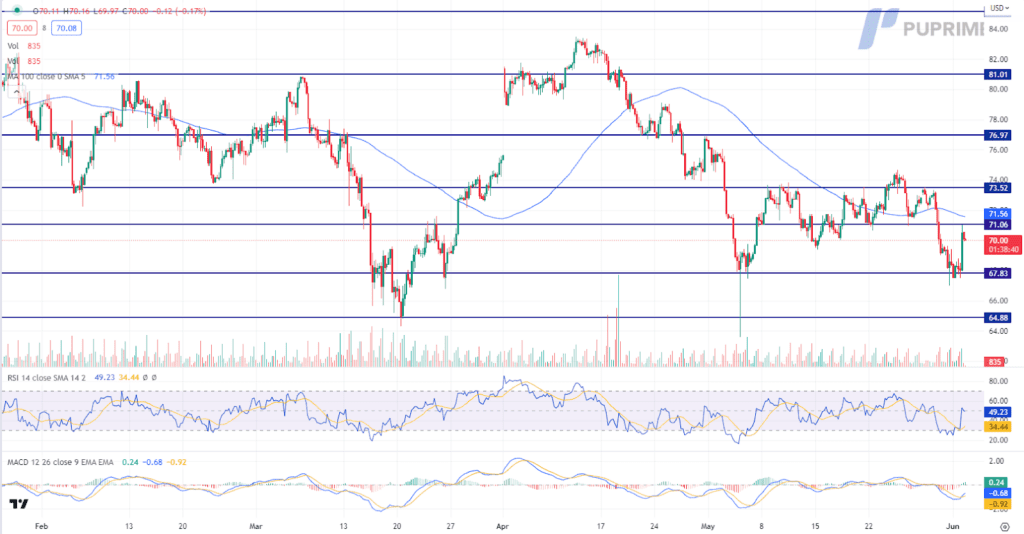
The rally in oil prices, driven by market anticipation ahead of the OPEC+ meeting, highlights the underlying uncertainties surrounding supply dynamics. While OPEC+ sources suggest a reluctance to deepen supply cuts, analysts continue to debate the possibility given disappointing demand indicators from key economies. Additionally, the dovish rhetoric from Federal Reserve officials and the resultant depreciation of the US Dollar have provided support for oil prices.
Oil prices are trading higher following the prior rebound from the support level. MACD has illustrated increasing bullish momentum, while RSI is at 49, suggesting the commodity might extend its gains since the RSI rebounded sharply from oversold territory.
Resistance level: 71.00, 73.50
Support level: 67.85, 64.90

Trade forex, indices, cryptocurrencies, and more at industry-low spreads and lightning-fast execution.

12 December 2023, 05:38 All Eyes On U.S. CPI Reading

11 December 2023, 05:23 Dollar Surges On Exceptional Jobs Data

8 December 2023, 05:50 Yen Rallies On BoJ Hawkish Comment

新註冊暫停
我們目前暫不接受新的註冊。
雖然目前無法接受新註冊,但現有用戶仍可照常進行挑戰和交易活動。